
by Ryan P. Burge, Eastern Illinois University
It’s a rare day when I don’t do some type of statistical analysis with survey data related to religion and/or politics. When I am presented with a question about what the public feels or how they behave in these areas, I immediately know which datasets would yield the best results. Becoming so familiar with a lot of the data out there has led me to notice some discrepancies between surveys.
The biggest, and most nagging, disagreement is in the percentage of the population who are classified as religiously unaffiliated – the “nones.” The two surveys in question are the General Social Survey, which has been conducted at least biannually since 1972. It asks: “What is your religious preference? Is it Protestant, Catholic, Jewish, some other religion, or no religion?” The other is Cooperative Congressional Election Study, which has been conducted since 2006. The CCES uses an approach to measuring religious affiliation that was developed by the Pew Research Center. It asks: “What is your present religion, if any?” Then there are eleven potential choices listed, with three possibilities for the nones: atheist, agnostic, and nothing in particular.
When you compare those who say they have “no religion” in the GSS, to those who say they are either atheist, agnostic, or nothing in particular in the CCES, a significant difference emerges.

In 2008, the GSS indicates that 16.7% of the population are nones, while the CCES has the estimate higher at 22.3% – a gap of 5.6%. The Census bureau reports that there are 250 million adults in the United States, therefore that difference amounts to 15 million adult Americans. And the discrepancy widens from there. In 2014, it jumped to 7.1%. By 2018, it had expanded to 8.2%. These differences can’t be chalked up to random sampling error. There has to be something systematically happening that produces such a consistent and growing discrepancy.
Part of the reason that the CCES might produce such a higher estimate is because it offers three options for the nones, while the GSS has just a “no religion” option. You can see from the visualization below that the “nothing in particular” option in the CCES tracks very closely with the “no religion” choice in the GSS. However, remember that the CCES also allows people to identify as an atheist or agnostic.

Beginning in 2010, the CCES sample is at least 5% agnostic, climbing to a peak of 5.7% in 2018. Atheists have seen a similar trajectory. They were 3.4% in 2008 but quickly rose to 4.4% by 2012. In 2018, they were 5.7% of the sample – the same share as agnostics. In 2018, the CCES was 19.8% nothing in particular, 5.7% atheist, and 5.7% agnostic for a total of 31.4%, compared to 23.3% who identified as “no religion” in the GSS.
So, if the nones are larger in the CCES that means that other religious groups must be smaller. If we look at how many people identify as Protestants or Catholics in the GSS versus the CCES, it’s possible to get a sense of where that eight percent of the population ends up in the GSS sample.
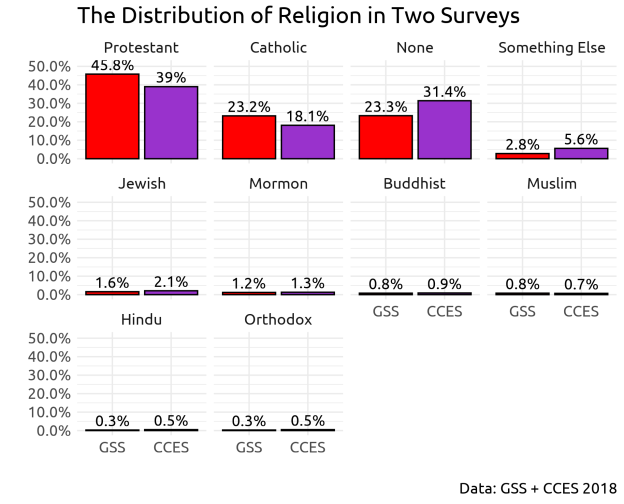
It’s fairly clear that the samples are almost identical when it comes to smaller religious groups. The share of Buddhists, Mormons, Jews, Muslims, Hindus, and Orthodox Christians is within the margin of error between the two samples. However, there are notable differences in both the size of Protestants and Catholics. In both cases, the GSS indicates that the share of Americans who fall into these two Christian groups is larger than is in the CCES. In fact, the GSS says that the United States is seven percent more Protestant than the CCES and five percent more Catholic. At the same time a person is twice as likely to say that they are “something else” in the CCES as the GSS.
So, people are more likely to pick the Protestant or Catholic category in the GSS than the CCES, but what type of people would be more likely to identify differently in the General Social Survey? The first place to look would be marginally attached Protestants and Catholics. These are the type of people who say that, despite their religious affiliation, they never attend church services. Therefore we should expect to see the share of never attending Christians to be higher in the GSS than the CCES.

And, in fact, we see that clearly in the data on the Protestant side. The share of Protestants who say they never attend in the GSS is nearly double the rate found in the CCES. There is a difference for Catholics as well, at 2.2 percentage points. What is likely happening here is that the CCES is making it easier for people who feel very weakly attached to religion to declare a “none” affiliation than those taking the GSS. In effect, it would appear the end result is that the GSS is undercounting the true number of the religiously unaffiliated.
But why would people not express their true intentions on the GSS, while they are more forthright on the CCES? I think that the answer rests largely on social desirability bias. That’s the phenomenon where people tend to lie on survey instruments because they want to look good in the eyes of the person administering the survey. It’s a serious problem when asking questions about sexual behavior, drug use, racism, sexism, and religion. I think that the CCES mitigates this for two reasons. One is that it gives people so many options to respond to the religion question – specifically the “nothing in particular” option. The other is that the GSS is still conducted by a survey administrator asking questions of respondents, while the CCES is computer-based. People are less likely to lie to a computer than they are to a person.
And other countries have struggled with how to ask a census question about religion. For instance, when Australia changed it’s question procedure, the share of the nones jumped dramatically. Ireland is also trying to determine the most accurate way to ask about religion, as well.
The upshot is this: the share of Americans who have no religious affiliation is nearly a third of the United States, not the 23.1% figure which comes from the GSS. However, I don’t advocate for the GSS to change how it asks their religion question. It has used the same format for forty-six years now. It gives us a baseline metric that is invaluable. In essence, the GSS number has become a standard unit of measure in social science. But, we need to take that number with a grain of salt – it likely mischaracterizes the true (non)religious affiliation of the American public.
This research was published at the Review of Religious Research. You can read the full version of the paper here.
Ryan P. Burge teaches at Eastern Illinois University in Charleston, Illinois. He can be contacted via Twitter or his personal website. The syntax for this post can be found here.

This is very dismissive of the smaller religions (in the USA, there are a lot of Hindus elsewhere). I would be very interested in knowing the sample sizes as the differences for Jewish, Hindu and Orthodox may well be significant if dealt with over the population. Without access to the numbers it is not reasonable to call a 30% or even 60% increase significant but it is also not reasonable to ignore it based on sample size meant for the larger populations. As a statistician I would want to investigate those numbers more seriously. Ignoring them is dangerous and may also give an understanding as to why there are differences in other groups.
If the sample size is approximately 1000 then you are dealing with +/- 2% so the smaller numbers become pointless. But find 1000 of those that chose Hindu in the census and compare – now that would be meaningful – unfortunately, we then start running into sample bias. Anyway, ignore those apparently small figures at your peril, they may be the answer to your question.
LikeLike
[…] has dug as deeply into this as the ever-prolific Ryan P. Burge of Eastern Illinois University, who just posted about two major data sets he’s been analyzing for a while: the General Social Survey (GSS), which has gone out at least […]
LikeLike
[…] things to keep in mind about nothing in particulars though. The first is that they are large – about 20% of the population in 2018. But, they also have lower levels of education than all other religious groups, which means voter […]
LikeLike
[…] ample evidence emerging that the GSS undercounts the share of Americans who have no religious belonging because some survey […]
LikeLike
[…] ample evidence emerging that the GSS undercounts the share of Americans who have no religious belonging because some […]
LikeLike
[…] ample evidence emerging that the GSS undercounts the share of Americans who have no religious belonging because some […]
LikeLike
[…] ample evidence emerging that the GSS undercounts the share of Americans who have no religious belonging because some […]
LikeLike