Featured Image Credit: On Being on Flickr
by Ryan P. Burge, Eastern Illinois University
When Donald Trump won, it was an absolute surprise to those who are in the business of predicting presidential elections. Places that President Obama won handily like Iowa and Wisconsin, were lost by Hillary Clinton.
There have a number of postmortems regarding how the polls were so wrong and how political science can learn from these failures in the future. The most expansive is Nate Silver’s five part piece on “The Real Story of 2016.” The answer is a complicated one, and is related to a number of factors including an important late break by undecided voters toward Donald Trump and the quirks of the Electoral College.
When it comes to religious voters in 2016, the most well publicized statistic is that 81% of evangelicals cast their vote for Trump. I wanted to place these results in some context to try and identify patterns regarding how Trump did in counties that are religiously diverse.
To determine a measure of diversity I used the 2010 Religious Census Data, which is freely available on the ARDA website. I chose 7 religious traditions that would typically be the most popular in every county in the United State: evangelical Protestants, mainline Protestants, black Protestants, Catholics, Latter-Day Saints, Orthodox Christians, and Jews. Then I used a function that determined which was the largest group in each of the counties in the U.S. My logic is straightforward: if a county has a low level of adherents to all those traditions, it is going to be religiously diverse. One could argue that if there aren’t many adherents to those five traditions then they are probably non-affiliated. I would argue that non-affiliated is really not a tradition and a county full of non-affiliates would be pretty diverse religiously because they are not homogeneous.
The scale is from 0 (no diversity – purple) to 1 (complete diversity – yellow).

The most purple counties follow what we would assume regarding religious homogeneity. Utah is purple because the Mormon church makes up over 60% of the population of the state. The southern states are also less religiously diverse, with especially high concentrations in Kentucky, Mississippi, and Alabama.
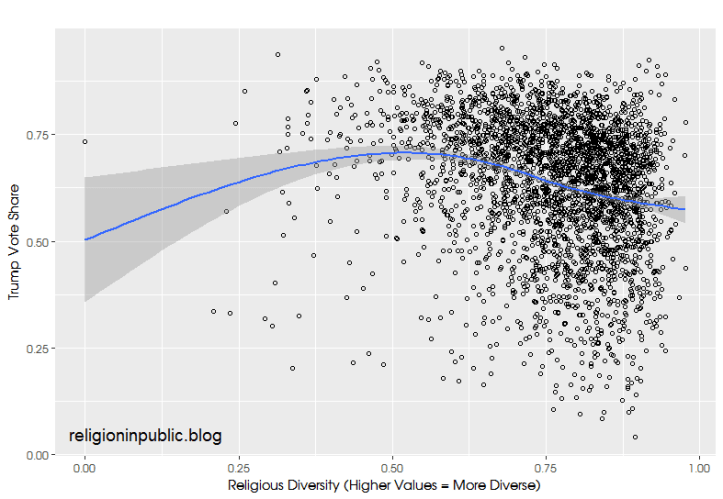
I then created the scatterplot (above) in an attempt to determine how well Trump did in more heterogeneous counties. There are very few counties that are lower than .5 on the diversity scale (x-axis), but once you move past that threshold, a clear pattern emerges. The more diverse a county religiously, the worse Trump did. To put this in real terms, for every 10% increase in religious diversity, Trump’s vote share dropped by 3.4%.
Obviously, this is a very crude approach to understanding Trump’s success. Religious diversity is more likely to be found in large metropolitan areas, while religious homogeneity is more likely in rural areas that have lower levels of education. Previous analysis has concluded that the level of education in a county was the strongest predictor of more support for Trump.
There has been a lot of ink spilled in the last ten years about people sorting – moving to conservative areas if they are politically conservative, but it’s unlikely the same would be true in the religious arena. Because of the diffuse nature of American religion it is not hard to find a particular religious tradition in almost every geographic area of the United States. The larger concern however comes from citizens having real opportunities to come in contact with people who worship or vote differently than they do. There is a long tradition in social science, often described as “social contagion” that indicates individuals who interact in heterogeneous environments evince higher levels of tolerance and inclusiveness. One must wonder if churches are really advancing contagion or merely becoming reinforcers of previously held beliefs.
Ryan P. Burge teaches at Eastern Illinois University in Charleston, Illinois. He can be contacted via Twitter or his personal website.
Code for this analysis can be found on my Github.
