by Ryan P. Burge, Eastern Illinois University
This should come as no shock, but immigration is President Trump’s signature issue. He campaigned on building a wall that Mexico would pay for. ICE enforcement has ramped up dramatically with the number of daily immigrants arrested up nearly 50% since he took office. Nearly half a million immigrants in the United States under the temporary protective status program have had their legal protections ended by the Trump administration. Additionally, under Trump directives the number of visas issued to individuals wanting to come to this country legally was down approximately 13% in 2018. Not to mention that the status of DACA recipients is still very much uncertain.
Using this national debate as a backdrop, it seems helpful to ask some basic questions: Are certain religious groups going to be hurt disproportionately by these immigration policies? What do immigrants who come to the United States look like? What are their racial backgrounds? What are their religious traditions? The 2016 Cooperative Congressional Election study asked all 64,600 respondents: “Which of these statements best describes you?” and were given the following options:
- Immigrant Citizen
- Immigrant non-citizen
- First Generation
- Second Generation
- Third Generation
The answers to this question paint a fascinating picture of the American population. For instance, nearly 3 in 10 respondents indicated that their family has been in the country for two generations or less. Said another way, 30% of Americans indicate that their great grandparents did not live in the United States.

How does that break down by religious tradition? The above graph displays the differences graphically. Note that Black Protestants, Evangelicals, and Mainline Protestants all have below average numbers of recent immigrants. For instance, over 3 in 4 evangelicals say that they are at least the third generation of their family to be American citizens. On other hand, nearly three quarters of Jewish people immigrated to the United States in the last two generations. Note that the group with the highest percentage of immigrants is those of “other faith.” This category contains those who affiliate with faiths like Buddhism, Hinduism, or Islam.
It’s clear that there are tremendous differences in the percentages of immigrants from each of the religious traditions, however are there differences in the composition of these immigrant groups? The CCES does not ask respondents what country they have immigrated from, but it does ask what race each individual identifies with, which can serve as a (imperfect) proxy for region of origin.
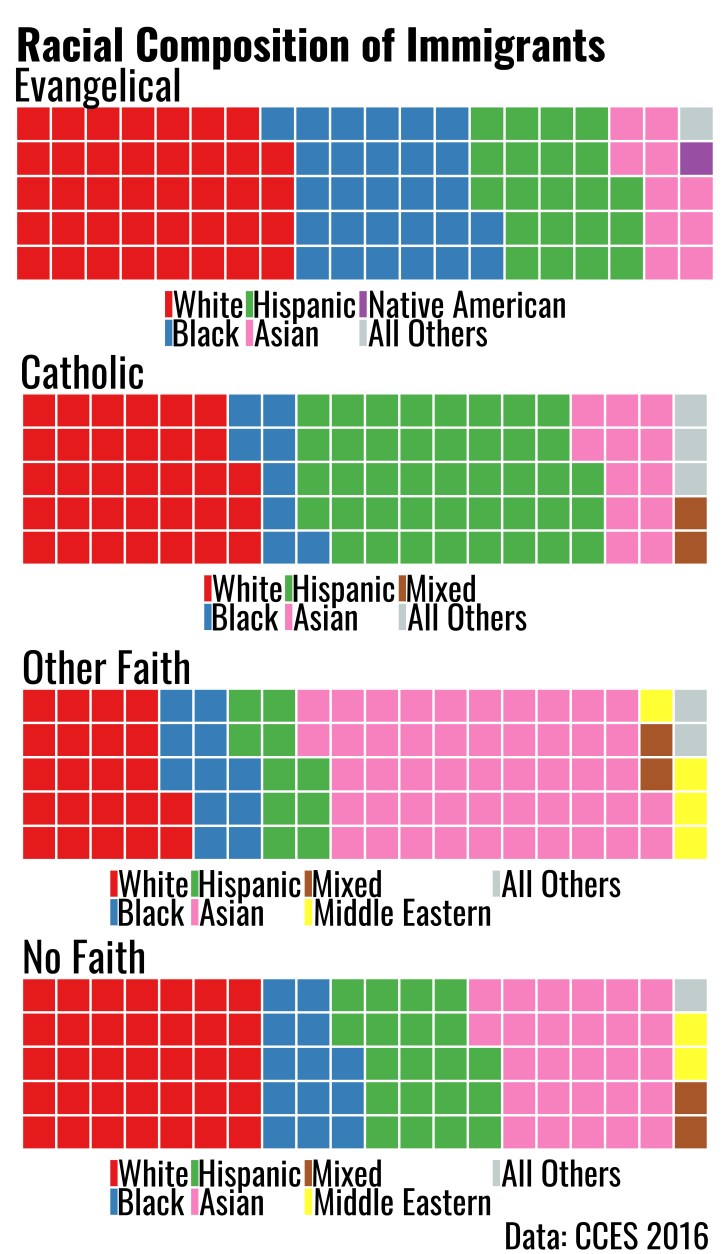
Each square of the waffle chart below represents one percent of those who identified as an immigrant on the survey. It becomes readily apparent that there are tremendous differences in the racial composition of these religious groups. For immigrant evangelical, about four in ten identified as white, while three in ten identified as black. 20 percent said that they were Hispanic and ten percent said that they were Asian. Of all the groups analyzed, evangelicals indicated the highest percentage of black immigrants. While it is not possible to know for certain, this could be due to a great number of African Pentecostals coming to the United States.
The racial composition of Catholic immigrants looks much different. Most notably, there are much lower levels of black immigrants but a dramatic increase in the number of Hispanic immigrants coming to the United States. It seems likely that many of these immigrants came to the United States from countries in Central and South America where Catholicism dominates the religious landscape.
The bottom two panels represent those of “other faith” and those of “no faith.” For those of other faith who recently immigrated, nearly half (49%) identify themselves as Asians. As previously mentioned, this category contains many religious traditions that are prevalent in southeast Asia including Buddhism and Hinduism and that is reflected in these results. For those of “no faith” a reasonably balanced mix is evident. Approximately 1/3 of “nones” are white, 27% are Asian, 20% are Hispanic, and 13% are black.
When an evangelical immigrant enters the country, one has to wonder how quickly they can integrate with the American evangelical community. The CCES asks a handful of question about religious activity including questions about the frequency of prayer and church attendance. The four scatterplots below display the frequency of church attendance on the x-axis and the frequency of prayer on the y-axis. It’s evident for each of the four groups that the top right of the plot is densely packed indicating high levels of religious activity. But what may tell a more important story is the bottom left portion of the plot which contains evangelicals who never pray and never attend church. Notice that this section contains many dots for 3rd generation individuals, yet as one moves to those who have come to the country more recently that area of the plot becomes more sparse. This visual finding buttresses a staggering statistic: recent evangelical immigrants to the United States indicate higher levels of prayer and church attendance than any other group. While it is not possible to know for certain with this data, it seems likely that many evangelical immigrants use the local church as a means to integrate themselves into the community.

Finally, it would be impossible to discuss the topic of immigrants without taking a look at how those who recently arrived in the United States voted in the 2016 Presidential Election. The above graphic displays the percentage of the two party vote for Donald Trump for each immigrant group. It comes as no surprise that 2nd and 3rd generation evangelicals were strong supporters of Trump’s candidacy, with support between 70-80%. However it is noteworthy that even evangelicals who are recent immigrants to the United States were also supportive of a Trump presidency. Nearly 3 in 5 evangelical immigrants cast their votes for the GOP nominee, which is much higher than the other three groups analyzed. Consider this: Catholic immigrants were half as likely to vote for Trump than evangelicals immigrants. The general trend for each of these four groups is that Hillary Clinton received higher levels of support from immigrants and first-generation citizens, while Trump did better among those who could trace their family history back at least two generations in the United States. Of course, much of these differences is rooted in race.

It’s apparent that there are a great deal of evangelical immigrants who attend frequently in addition to the fact that 60% of this same population group supported Donald Trump. It is possible that these two things are related. There are some results that indicate that greater levels of church attendance are related to higher levels of support for the GOP candidate. For those who attended at least weekly, 61% voted for Trump, however for those who attended church between once a month and once a year, a majority favored Hillary Clinton (52%-48%). Evangelical churches hold an interesting position in the lives of immigrants. For many evangelicals coming to the United States, church life creates a conduit to fellowship and a sense of community, but on the other hand that community can have a tremendous impact on the political socialization of recent immigrants. It seems that this situation would be much more acceptable to those who identify as Republicans, while seeming much less palatable to those who oppose Donald Trump. What is not under debate, however, is that religion is a key part of the picture of immigration in the United States.
Ryan P. Burge teaches at Eastern Illinois University in Charleston, Illinois. He can be contacted via Twitter or his personal website. The syntax for the post can be found in here.
Featured Image Credit: Semipartisan Sam
