Featured Image Credit: Religico
By Ryan P. Burge, Eastern Illinois University
EDIT: There was a mistake in the original post. My definition of evangelical came from the “reltrad” classification scheme, which indicates that evangelicalism includes all races except for African-American (which fall into the Black Protestant category). Allowing Hispanics, Asians, etc. into that measure makes it less pro-Trump. The new measure contained in the updated post is only WHITE evangelicals. Trump’s margin was much higher (60% -> 75.8%).
We’ve heard quite a bit by now about the overwhelming evangelical Protestant support for Donald Trump in this election cycle. But we have precious little else to point to help draw the rest of the religious voting map. In this endeavor we are greatly aided by the recent release of the Cooperative Congressional Election Study. The most notable aspect of the survey is its sheer size. In the 2016 variant, there were 64,600 adult respondents who answered questions both before and after the November presidential election. This affords researchers a tremendous ability to have a deep understanding of how lots of smaller subgroups cast their ballots in the 2016 election. It’s our plan at Religion in Public to use these data to take a deeper dive into several smaller religious subgroups that are often ignored (by data necessity) in the scholarly literature. I wanted to begin by taking a broad view of how a variety of religious traditions voted in 2016.
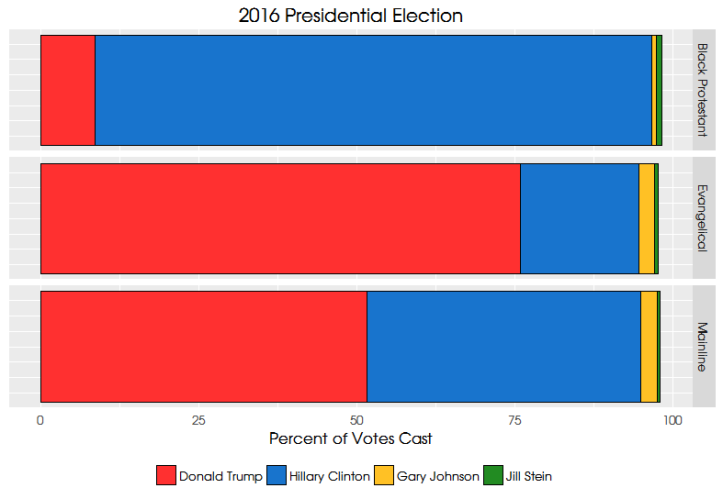
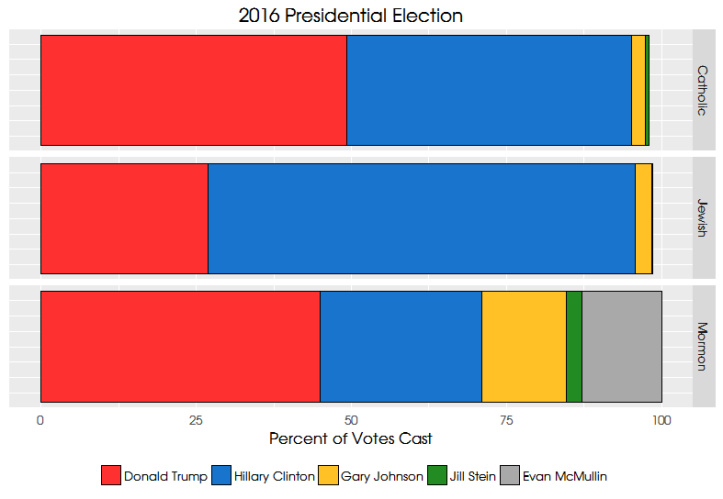
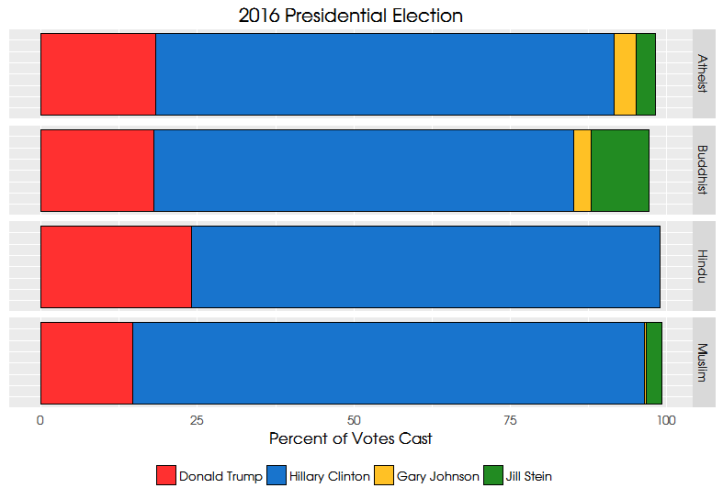
The most widely used classification scheme for religious traditions is reltrad, and it was followed as closely as possible here based on the classification of denominations The three primary groups of Protestants under reltrad are evangelicals, mainline Protestants, and black Protestants. What the following histograms contain is the percentage of reported votes cast for one of the four major presidential candidates: Trump, Clinton, Johnson, or Stein. If a respondent didn’t remember who they voted for, didn’t cast a ballot, or wrote in a name on their ballot, they were excluded in this analysis.(note 1)

It’s clear that there was a dramatic difference between how black Protestants voted compared to their counterparts in the evangelical or mainline traditions. According to this data 88.1% of black Protestants voted for Clinton, while just 18.8% of evangelicals and 43.4% of mainliners did the same. Evangelicals are the real story here. Exit polls released the day after the election indicated that 80% of evangelicals voted for Trump, but this analysis casts some doubt on those results. The CCES indicates 75.8% voted for Trump. What accounts for the difference? One possible explanation is the way that we define evangelicals. There’s a fierce debate among scholars on the proper way to sort religious traditions. It’s not exactly clear how the Washington Post defines the term. Either way, this slightly changes the narrative. While evangelicals were the only tradition in which a strong majority voted for Trump, it may not have been nearly as unanimous as the exit polls portrayed.

Consistent with elections over the past several decades, Catholics evinced a more divided voting pattern. 46% of Catholics voted for Clinton, 49.2% for Trump. On the other hand, Jews were overwhelmingly for Clinton: 69% for her, 27% for Trump. Jewish voters have long been attached to the Democrat party and that didn’t change in 2016. The Mormon vote is much more conflicted than the other traditions. While 45% voted for Trump, Clinton got 26%, Johnson got 13.5%, Evan McMullin got 13%, and Jill Stein got 2.5%. Mitt Romney got 73% of Utah’s vote in 2012, but Trump got only 46% in 2016, largely attributable to the Mormon defection from Trump. However, it is crucial to note that Mormons’ distaste for Trump did not necessarily translate to votes for Clinton. She only garnered 3% more of the vote in Utah than Obama did in 2012. Instead they shifted to Johnson and McMullin in significant numbers.

One of the most intriguing parts of the CCES data is that reasonably large samples of what are typically understudied religious groups. Muslims, Buddhists, and Hindus all voted overwhelmingly for Clinton. Just 15% of Muslims voted for Trump and 82% for Clinton. One small quirk of the data is how many Buddhists voted for Stein: over 9%. That was the largest Stein contingent of all the traditions. Atheists/Agnostics were strong Hillary supporters (73.3%). In this sample there were over 8,000 in the subgroup, which is only slightly lower than mainline Protestants. It’s becoming apparent that this group will only continue to grow and if their penchant for voting for Democrats continues, that could spell trouble for the Republican Party at the national level in years to come.
Taken together the results are clear. Trump did the best among evangelicals, but as one moves to religious minorities (i.e., Muslims, Hindus, and Buddhists) Clinton was the overwhelming favorite. Fortunately for President Trump evangelicals made up about one quarter of the sample, while those three minority groups together comprise just 2%. We will take a longer look at these results in subsequent posts and hope to provide a more complete picture of religion in the 2016 election.
Ryan P. Burge teaches at Eastern Illinois University in Charleston, Illinois. He can be contacted via Twitter or his personal website.
Notes
1 In addition, the analysis displayed here contained sampling weights calculated by the authors of the CCES.

[…] Burge recently authored a blog post stating that the CCES found that 60 percent of evangelicals voted for Trump, he later had to issue […]
LikeLike
[…] a previous post, I noted that Donald Trump received 75% of the white evangelical vote in the 2016 presidential […]
LikeLike
[…] post semi-regularly about measuring of conservative Christians in the United States (see here and here, for examples), but answers never come easy as to what exactly the terms means as can be seen in a […]
LikeLike
Curious if alternate to the reltrad you considered the pew_bornagain variable included in the survey and CCES2016 data?
LikeLike
Here is a quick breakdown using that pew born again variable:
> # in CCES2016 Presidential vote is variable CC16_410a
> WhiteBornAgainVoters votes votes votes[1:2,]
Male Female
Donald Trump (Republican) 2900 3591
Hillary Clinton (Democrat) 652 1038
> round(prop.table(as.matrix(votes[1:5,]),2),2)
Male Female
Donald Trump (Republican) 0.75 0.72
Hillary Clinton (Democrat) 0.17 0.21
Gary Johnson (Libertarian) 0.04 0.04
Jill Stein (Green) 0.01 0.01
Other 0.03 0.03
> chisq.test(votes[1:5,-1])
Chi-squared test for given probabilities
data: votes[1:5, -1]
X-squared = 9038.6, df = 4, p-value < 2.2e-16
Looks like in this simple analysis of a subset of "white" and "born again", women were actually significantly more likely to vote for Clinton than men, by about 4%.
Would be interesting to look into other differences between born again vs evangelical as defined be reltrad…
Cheers,
Ben
LikeLike
Hey Ben-
My self and a colleague, Andrew Lewis, have a paper under review now where we make the case that White + Born Again + Protestant is the functional equivalent of White + RELTRAD Evangelical. The differences in the two samples is pretty minor looking at several different surveys.
Here’s a link to the WIP, if you are interested.
Click to access 6.22.17_POQ-Submit-UnBlind.pdf
LikeLike
[…] With a Republican field chock full of aspirants with credible religious credentials, it’s fair to say that few thought evangelical attachment to Trump a likely scenario. By March, it was apparent that something unexpected was happening, but even then the storyline, backed by some data, was that it was the bad evangelicals (those less observant) who jumped to Trump. Trump, of course, steamrolled through the Republican nomination process and narrowly captured enough states in November for a “blowout,” “massive landslide.” For their part, white evangelicals were all in – fully 80% voted for Trump according to exit polls and analysis of the CCES on this blog indicated about 76% support (here). […]
LikeLike
[…] Cooperative Congressional Election Study, a source that we have used extensively at Religion in Public asks, “What do you think the U.S. government should do about immigration?” […]
LikeLike
[…] Religion in Public that has gotten the most search traffic over the last six months is entitled, “The 2016 Religious Vote (for more groups than you thought possible).” That post contains voting behavior statistics for just about every religious group in the United […]
LikeLike
[…] as Democrats. While it’s unclear how many Methodists specifically voted for Trump in 2016, about 50 percent of mainline Protestants overall voted for Trump, compared to 81 percent of white […]
LikeLike
“While evangelicals were the only tradition in which a majority voted for Trump….” Huh? Your own data, in the same paragraph, says only 43.4% of “mainline” protestants voted for Hillary. Those two claims contradict each other, obviously.
LikeLike
Thanks for noticing the contradiction, William. I have amended the text to say: *strong* majority. Trump received 53.5% of the mainline vote, compared to 43.5% for Hillary Clinton and 2.7% for Gary Johnson.
LikeLike
[…] for the GOP, which is not that unusual, however considering that Mormon support for Trump was just about 51% in 2016, it’s clear that they can make a distinction between their own Congressional Republican and […]
LikeLike
[…] The election that pitted Donald Trump against Hillary Clinton put Mormons in a weird spot, though. While white evangelicals still supported the Republican at basically the same level (77.5%), it was Mormons who defected in large numbers. According to the data, just over half of Mormons pulled the lever for Trump, but that only led to a modest increase for Clinton. Instead, a quarter of all Mormon votes went to other candidates, with many choosing Evan McMullin. […]
LikeLike
[…] evangelicalism stipulate. And, after all those qualifications, it wasn’t even 81 percent: Later, better studies put that figure in the mid-70s, matching the very consistent rate at which self-identified […]
LikeLike
[…] stipulate. And, after all those qualifications, it wasn’t even 81 percent: Later, better studies put that figure in the mid-70s, matching the very consistent rate at which self-identified […]
LikeLike
[…] stipulate. And, after all those qualifications, it wasn’t even 81 percent: Later, better studies put that figure in the mid-70s, matching the very consistent rate at which self-identified […]
LikeLike
[…] stipulate. And, after all those qualifications, it wasn’t even 81 percent: Later, better studies put that figure in the mid-70s, matching the very consistent rate at which self-identified […]
LikeLike
[…] evangelicalism stipulate. And, after all those qualifications, it wasn’t even 81 percent: Later, better studies put that figure in the mid-70s, matching the very consistent rate at which self-identified […]
LikeLike
[…] evangelicalism stipulate. And, after all those qualifications, it wasn’t even 81 percent: Later, better studies put that figure in the mid-70s, matching the very consistent rate at which self-identified […]
LikeLike
[…] evangelicalism stipulate. And, after all those qualifications, it wasn’t even 81 percent: Later, better studies put that figure in the mid-70s, matching the very consistent rate at which self-identified […]
LikeLike