Featured Image Credit: MormonHub
By Ryan P. Burge, Eastern Illinois University
In a previous post, I found that the percent of Americans who believe that the Bible is literally true has not changed since the mid-1990’s using data from the General Social Survey. At the same time, there has been a notable increase in those who believe that the Bible is book of fables and a corresponding decline in those who believe that the Bible is inspired, but not literally true. I wanted to take a closer look at how that broke down by religious tradition and whether it is linked to political polarization.
Using the RELTRAD framework , I broke the sample down into seven religious traditions in order to determine if some religious groups have seen a shift in theological commitments over the last three decades.

Each graph contains the actual data points as well as a LOESS line that smooths out the trend in the data, with the darkened regions containing the standard errors. In broad terms, it is surprising how little has actually changed since 1984. Evangelicals saw a drop in literalism in the late 1990’s but that rebounded and is back to the same levels in the 2016 sample as it was in the mid-1980’s. Black Protestants look much like white evangelicals and have remained rather stable (considering the rather small samples involved). Mainline Protestants have seen a decline in literalists and have drifted toward an inspired view of the Bible. However, it’s important to note that the General Social Survey is not a panel design, meaning that new people are asked questions each survey year, instead of the same individuals. What that means in this instance is that it’s plausible that some literalist Mainliners left their church for a more evangelical church, which could account for the rise in evangelical literalism.
I also wanted to point out the last two groups: those of other faith and those of no faith. In both groups, there has been a move to away from literalism in regards to the Bible. This could be due to a number of factors, including a reduction in social desirability bias or that the Bible no longer holds such a revered place in American civil religion.
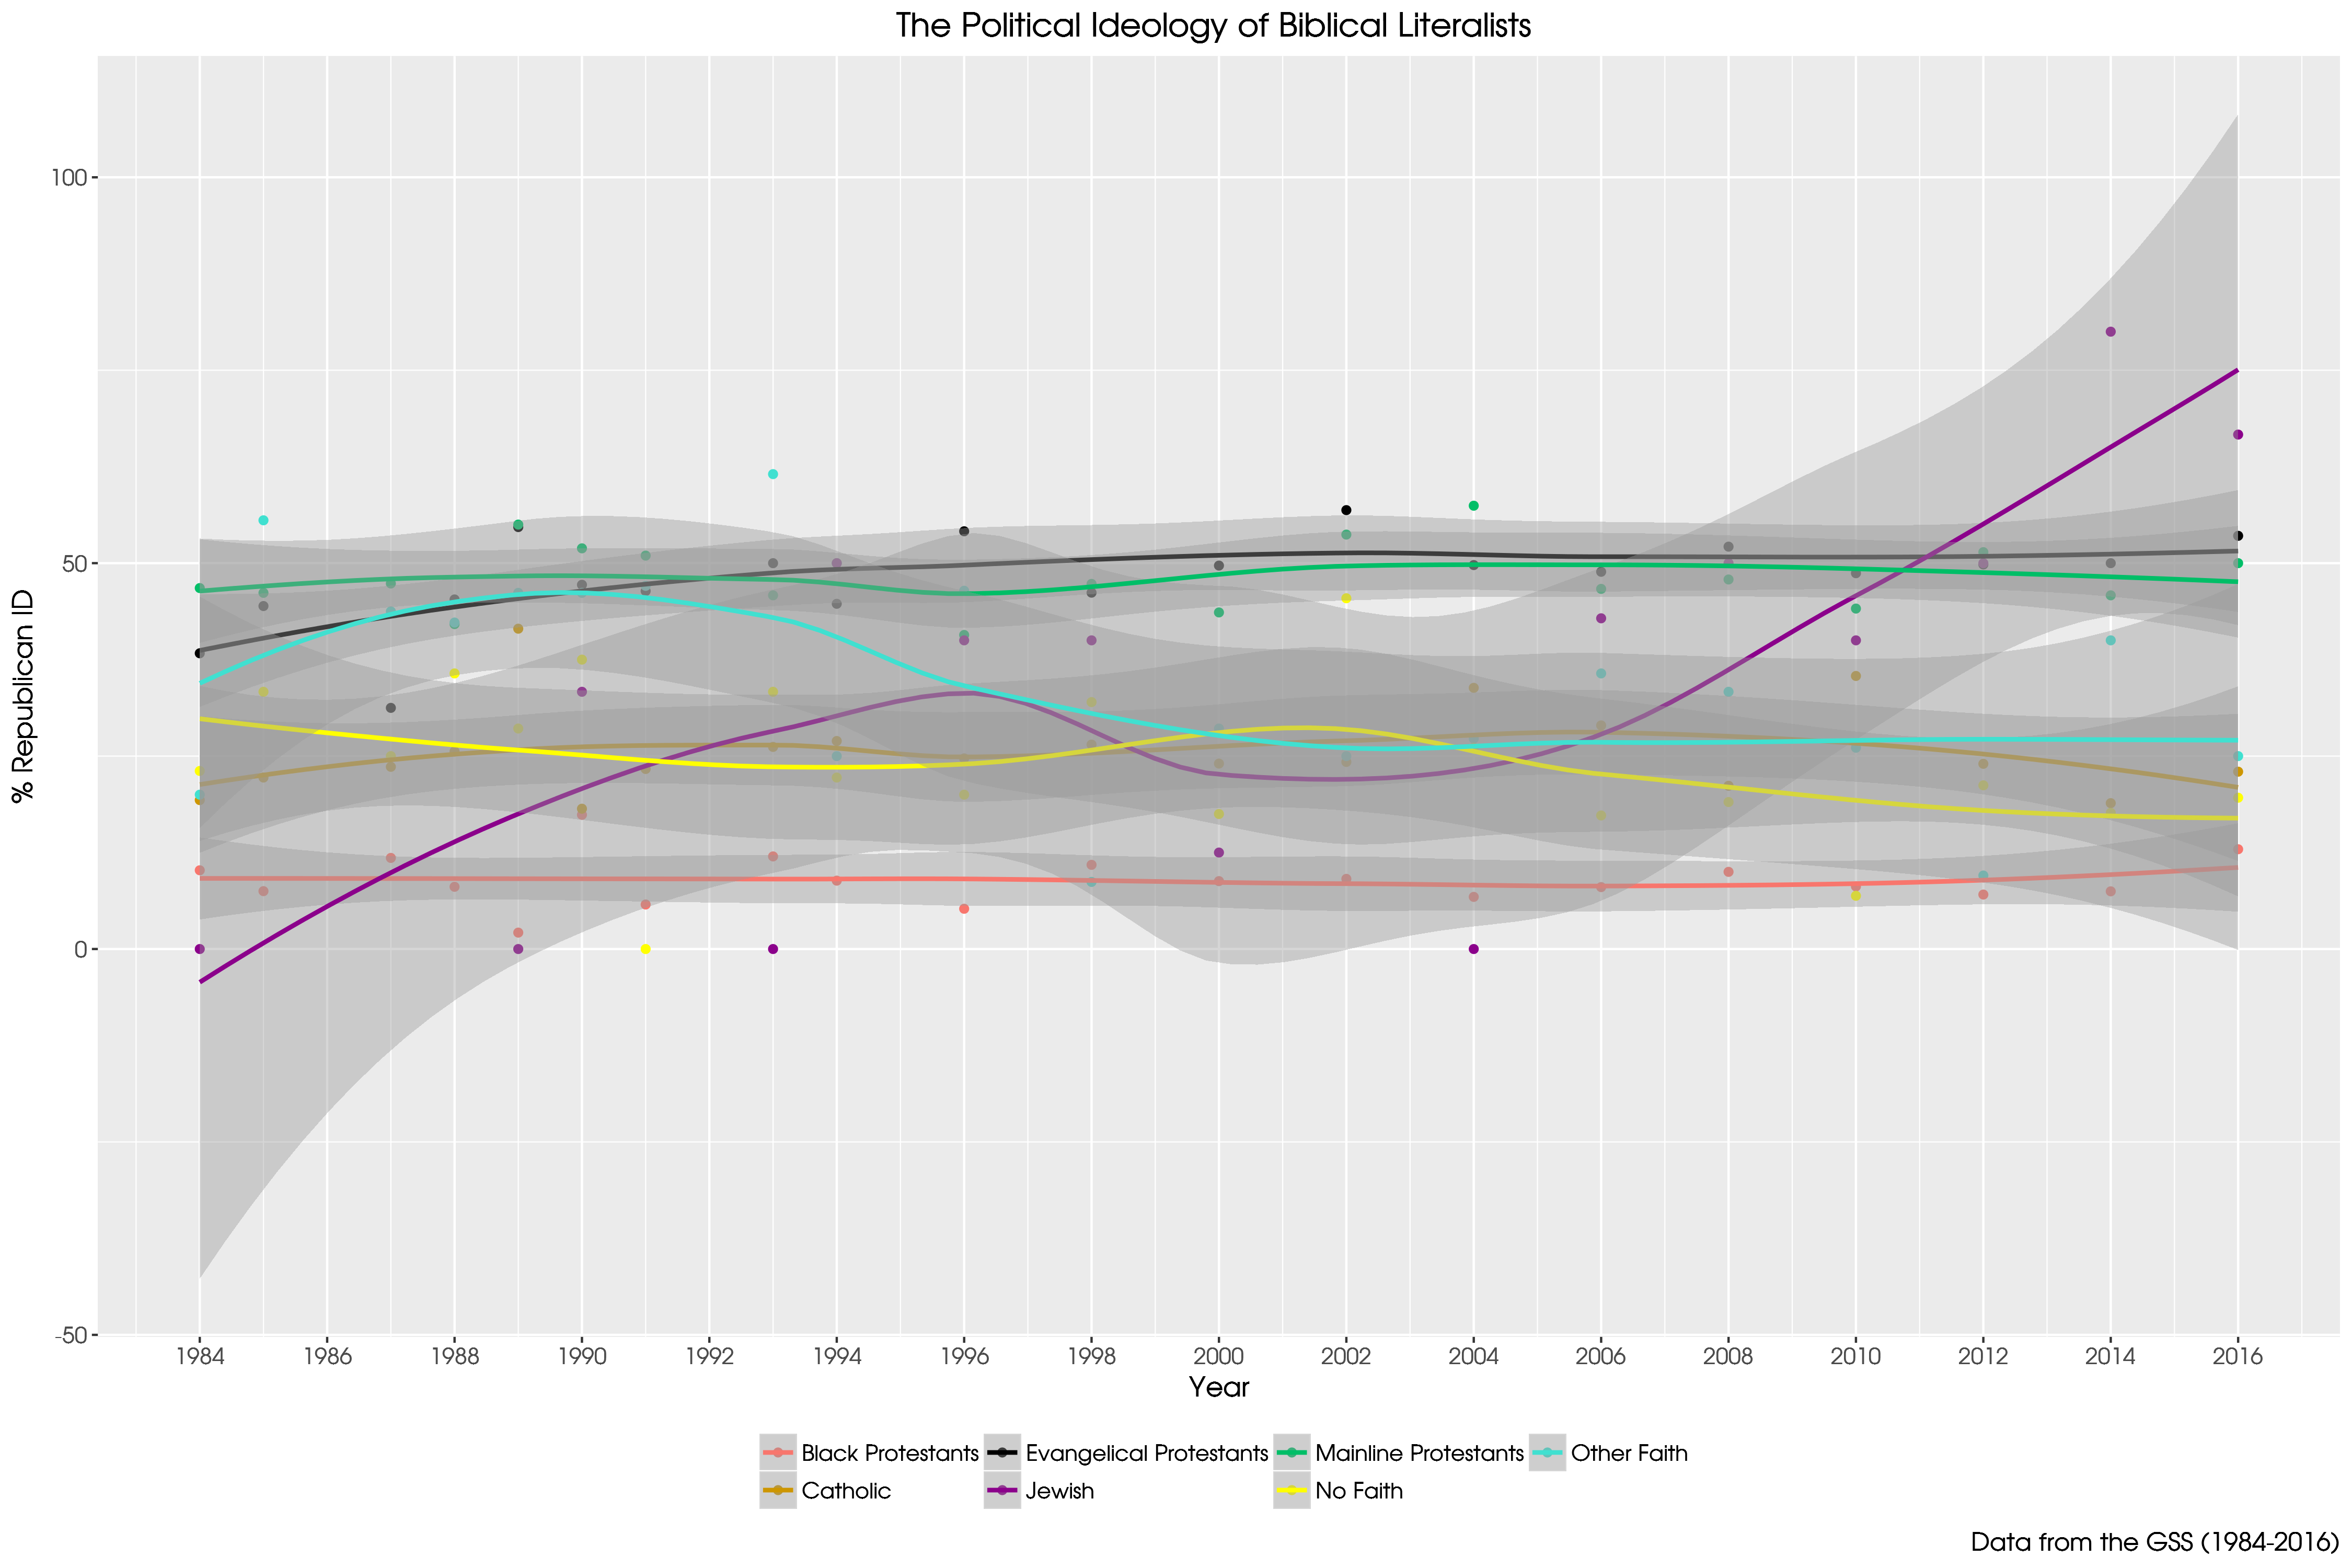
I also wanted to take a look at how literalists look politically in each of the seven religious traditions. What is displayed below is just the LOESS line without the data points or standard errors in order to see the trend more clearly (here’s the graph with those items added). The y-axis reflects the percentage of respondents who espoused a Republican partisanship in the seven point party id question (including those who “lean Republican”) which is more thoroughly described in a previous post.

Again, the story here is that there’s not much movement. There haven’t been drastic changes amongst the literalists of the seven groups. Evangelical literalists have become about 10% more Republican, but the entirety of that shift occurred between 1984 and the mid 1990’s. Since that point, there has not been a shift among evangelicals, nor has there been one in Mainline Protestants in the entire time span. Literalist Catholics became slightly more Republican, but that trend has reversed in the last decade. There are shifts among literalist Jews, but that group is so small it would be statistically overzealous to make too much of that result; the same can be said for those of other faith or those of no faith.
It’s somewhat staggering to consider the literalists in each of the Christian traditions and where they fall on the political spectrum. Evangelicals and Mainline Protestants are statistically indistinct. But the gap between these two groups and literalist Catholics is over 25 points. Moreover, while the Black Protestant tradition has about the same proportion of literalists as evangelicals, only 10% of those literalist Black Protestants are Republicans, while over 50% of white evangelicals indicated a partisan affiliation to the right of center.
I wanted to include one final visual to combine the political and the religious, which illustrates the prior point: there has been some religious and political change in the United States since 1984, but not much. Mainliners have become less Republican, while evangelicals have become more Republican. Across the board, this particular theological commitment/orientation has been surprisingly stable. Thus, overtime shifts in the population reflect the changing supply of religious groups in the nation.

To return to an earlier point, there may be something going on behind the scenes that we can’t see easily with this data. The GSS does a tremendous job of showing us intrareligious group changes, meaning how an individual tradition has changed over time. However, it is much more difficult for us to determine interreligious changes over time. It’s possible that many conservative Mainliners became evangelicals, but it’s also probable that many liberal Mainliners and evangelicals left their churches entirely and went into the “no faith” or “other faith” tradition. The American religious landscape may appear to be remarkably stable, but that may be papering over a religious economy that is rapidly shifting and possibly polarizing. While there has already been some excellent scholarship on religious switching in American society we are still a long way off from understanding the factors pushing and pulling on the religious landscape of the United States.
Full coding syntax for this analysis is available on my Github.
Ryan P. Burge teaches at Eastern Illinois University in Charleston, Illinois. He can be contacted via Twitter or his personal website.

[…] explain this pattern requires some conjecture, but harkens back to something that I’ve discussed in an earlier post, which is a sorting that is occurring in the religious landscape. Both Catholics and mainline […]
LikeLike