Featured Image Credit: HCLDR
By Ryan P. Burge, Eastern Illinois University
In a previous post, I used a machine learning algorithm to try to correctly guess whether members of a random sample of the General Social Survey were evangelicals. I like using machine learning because it’s unbiased by its very nature. The algorithm does not know the data I am using — all it knows is a series of grouped numbers. While my colleague Paul Djupe likes to consistently note that machine learning is atheoretical, I think it helps us to see if our perception of the religious world is confirmed by what AI (“artificial intelligence”) sees.
I used a technique called k-means clustering to try and understand what religious traditions have internal cleavages and what those dividing lines look like. Cluster analysis is often used in the business world to divide customers into different segments as a means to mail coupons or targeted advertisements, for instance.
Here I used the RELTRAD classification scheme and the General Social Survey from 2008-2016 to create my sample and generate my clusters. It’s crucial to note that I have labeled the x and y axes as first and second dimensions but this problem is really multi-dimensional which is hard to visualize in any meaningful way on a computer screen. When looking at the following visuals, understand that the space does not represent more or less of a variable, merely difference between clusters. So, these data displays are merely a simplification of the process. I used a variety of demographic variables (age, gender, race, and education) along with a measure of church attendance, view of the bible, party identification, several public opinion questions regarding federal spending on abortion, homosexual marriage, spending on drug rehabilitation, the military, welfare, and the environment to allow the clusters to form.
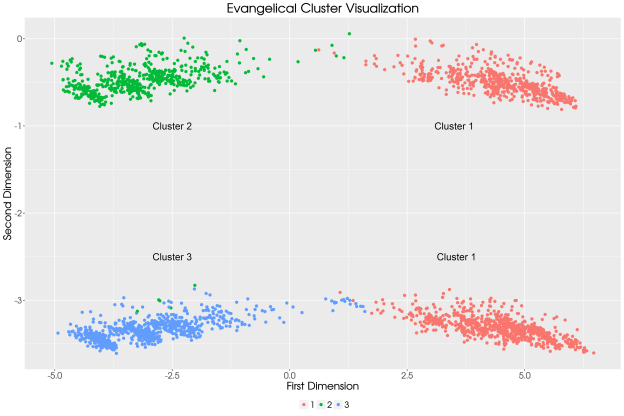
As is apparent from the evangelical Protestant visualization, clusters 2 and 3 are highly concentrated, but cluster 1 is bifurcated. That division is over the issue of biblical literalism. Cluster 2 (green) is 100% biblical literalists, Cluster 3 (blue) is less than 1% literalists. Cluster 2 (red) is 57% literalists. This cluster also falls in the middle of church attendance, support for abortion, political tolerance, and support for homosexual relations. This algorithm has determined that if one wants to break evangelicals into camps, their view of the bible is a perfect place to start.
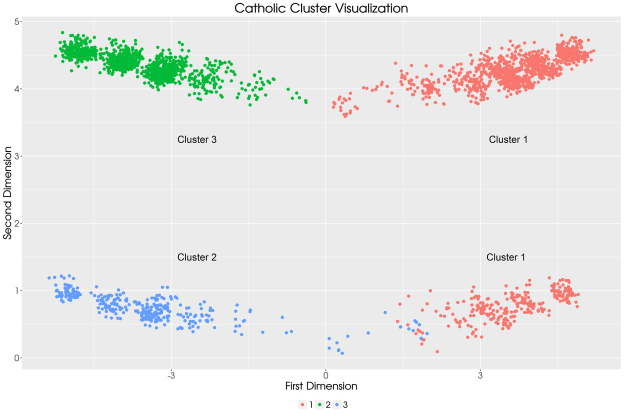
The Catholic clusters look fairly similar to the evangelical ones previously described, however the dividing issue for Catholics is not theological, but racial. Cluster 2 (blue) is 100% white, Cluster 3 (green) is 0% white, and Cluster 3 (red) is divided racially with 79% white composition. Compared to evangelicals, Catholics clusters are much homogeneous on the issue of biblical literalism. For example, Cluster 1 is 24% literalists, Cluster 2 is 21.2%, and Cluster 3 is the highest at 40.8%. Church attendance, age, and education are also closely bunched across these three clusters. However, Cluster 3 (green) is not only entirely comprised of people of color, it is also more conservative on the issue of abortion, and gay marriage compared to the other two clusters.

The mainline Protestant clustering is not as clear as their evangelical counterparts and the clusters are not nearly coherent for this group. From a theological point of view Cluster 1 (red) is the most liberal, while Cluster 2 (green) is the most conservative, and Cluster 3 (blue) is the middle. But even the most conservative cluster is only 36.1% literalist, compared to evangelicals who have a cluster at 100% literalists. In general, Cluster 1 is more progressive in a number of ways. They are more supportive of gay marriage and abortion. They are also younger, more highly educated, and attend church less frequently. But in general, these differences are not large which is why the clusters are not densely packed.
Surprisingly, Black Protestants are a mixed bag as well. Cluster 2 (green) is comprised of individuals who attend church the least frequently and this cluster also has the lowest number of literalists. This group is also the most supportive of gay marriage and abortion. The other two clusters are divided by spending issues. Cluster 1 (red) wants much less spending on welfare and drugs, while Cluster 3 (blue) wants to cut expenditures to the military and the environment. However, there is no difference between Clusters 1 and 3 on age, church attendance, party ideology, and education.

Taking a broad view, evangelical clusters are the most densely packed. In comparison, Catholics, mainliners, and Black Protestants are much more homogeneous and therefore the clusters are less coherent, less distinguishable. Trying to explain this pattern requires some conjecture, but harkens back to something that I’ve discussed in an earlier post, which is a sorting that is occurring in the religious landscape. Both Catholics and mainline traditions are filled with congregants who more widely distributed across the range of political beliefs. Evangelicals don’t see that diversity because they exist on the edge of the political spectrum.
Ryan P. Burge teaches at Eastern Illinois University in Charleston, Illinois. He can be contacted via Twitter or his personal website.
Full coding syntax for this analysis is available on my Github.
Note:
For each, I used three centroids, which produced the most efficacious clusters based on the ROC curve, which shows the tradeoff between sensitivity and specificity. Three centroids strikes the best balance.
