By Ryan P. Burge, Eastern Illinois University
If the United States as a whole looked like one specific religious group, which one would that be? I know that we spend a lot of time on this website talking about evangelicals, how to measure them, how they vote, how their share of the population has shifted over time, but in reality evangelicals do not look like the average voter. For instance take the following graph that I have posted a bunch.
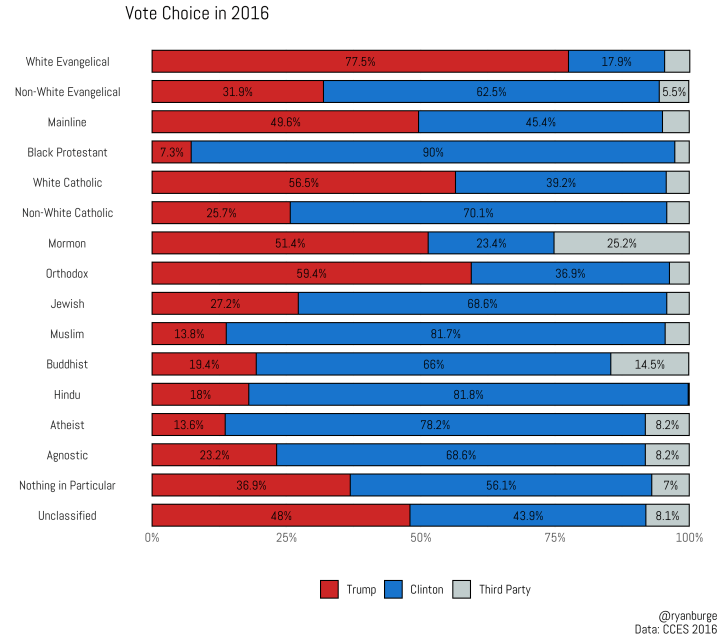
That top row is white evangelicals. Around 75% of them voted for Donald Trump for president. That’s a lot different than the 46.1% of the total popular vote Trump received. We write about evangelicals because they are so extreme. How about a group that’s more moderate? That looks more like America looks? As I looked down the list, you can see that the Catholic vote share is very similar to Trump’s overall share. Using that as a guide, I was poking around the Cooperative Congressional Election Study (2016) and stumbled upon a pretty amazing result: Catholics look very similar to the country as a whole on a range of demographic and political variables. Let me explain.
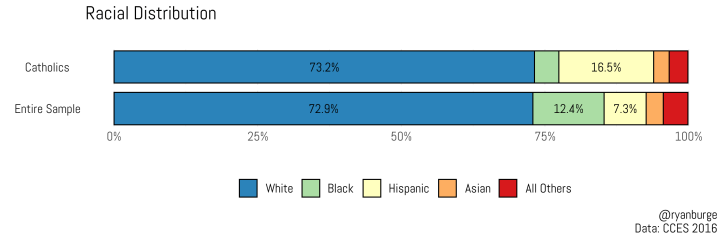
A good place to start is a racial breakdown that’s displayed in the graph above. 72.9% of the entire sample was white, while 73.2% of Catholics are white. That’s statistically indistinguishable. The only real difference between the two groups is that only 4.2% of Catholics are black, while 12.4% of the entire sample is African-American. And the Catholic sample is a little more than twice as likely to be Hispanic as the general population (16.5% vs. 7.4%).FOOTNOTE: Footnote When you return to the smaller racial groups like Asian-Americans, there is less than half a point of difference.
How about religious variables, though? There’s been a lot written online about the decline in Catholic identity and Catholic church attendance. But, compared to what? If we are comparing Catholics to evangelicals or Mormons there is obviously going to a significant difference, how about switching that comparison to the general population? Here’s what we see:

I had to remove those who never attend because that skewed the results: 30% of Americans claim no religion and therefore many of them never attend. There are a lot fewer Catholics who never attend than the general population. So, what the graph displays are those who said that they at least attend church seldomly. We can see that Catholics are less likely to be very frequent attenders, however they are more likely to attend services weekly. In fact, about a third of Catholics say they attend church every week. That’s statistically indistinguishable from the general population. The other categories look similar as well. Catholics attend church as much as Americans do.
How about the realm of politics? The media reported that Trump won the Catholic vote by seven points in the exit polls (52%-45%), however the CCES does not corroborate that narrative. Using this dataset, Trump’s margin was just two points (48.7% to 46.6%). Again, this is very close to the overall electorate.
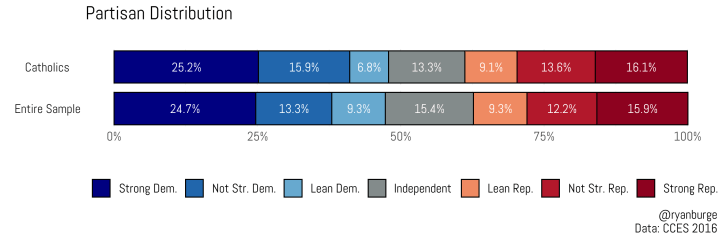
I wanted to look at political orientations and attitudes a little more closely. Party identification is always a good place to start. The self-described party ideology of the Catholics and the entire sample is displayed in the graph below. The results are uncannily similar. I had to check my code twice. Both the strong Democrat and strong Republican groups do not vary by more than one half of one percent. In fact, the largest difference in party identification for any of the seven categories does not? exceed 2.7%. If one wants to see what the United States looks like politically, they would be wise to observe the partisanship of American Catholics.
There have to be differences somewhere, right? One thing that the Catholic Church is known for in the realm of politics is their strong stance against abortion. The famous religious historian, Randall Balmer, has noted that Jerry Falwell actually got the idea to oppose abortion rights from the Catholic Church. So, one should suspect that Catholics should be more opposed to abortion than the general population. However, as the graph below describes: that’s not the case.
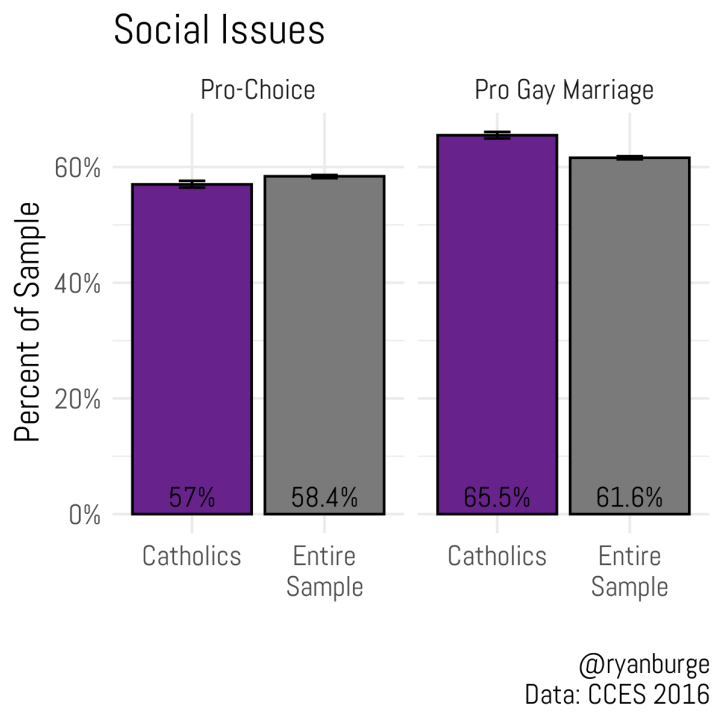
Observing two of the most prominent social issues of our times – abortion and gay marriage – it’s readily apparent that Catholics are not more conservative on either than the general population. On the issue of abortion, 1.4% fewer Catholics are in favor of women having the right to choose than the general population. On the issue of gay marriage, the gap widens somewhat (65.5% of Catholics favor same sex marriage, while that share of the general population is 61.6%). Taken together, there is no reason to believe that Catholics are any more conservative on social issues than the average American and may even be less so.
The question is, then, what to make of these findings? For the Catholic leadership this portends a bleak future. Catholics are not setting themselves apart from the population, generally, and many in the Catholic hierarchy believe this is leading to their decline. It’s clear that the Catholic laity are rejecting many of the tenets of the Catholic Church. For example, in 2012 Gallup found that 82% of Catholics are in favor of birth control, which is only 7% less than the support found in the general population. That stance is in direct opposition to Catholic doctrine. A previous analysis that I conducted indicates that nearly 7 in 10 Catholics are in favor of female clergy, which is just slightly lower than the population as a whole. It’s clear that the rank and file Catholic has little regard for the edicts coming from the Vatican or the American hierarchy.
The analysis begs the question what difference does it makes to attend Catholic Mass. Are practicing Catholics any different than “cultural Catholics.” The phrase “cultural Catholic”, meaning those who identity as Catholic but do not actively participate in any aspect of the Catholic faith, has become an essential part of measuring Catholicism in American culture. In 2015, Pew found that nearly 9% of Catholics identify as cultural Catholics. On top of cultural Catholics are those who have disaffiliated all together. Without the benefit of panel data, it’s difficult to measure this phenomenon. I’m going to try to untangle this question a bit more in a future post.
Ryan P. Burge teaches at Eastern Illinois University in Charleston, Illinois. He can be contacted via Twitter or his personal website.
Full coding syntax for this analysis is available on my Github.

[…] had the highest birth rate, despite the Catholic Church’s position on birth control. As mentioned here previously, Catholics are not keen on following the Church’s position in this area and that bears out in […]
LikeLike
[…] a year ago I wrote a post entitled, “Catholics Look Like America and America Looks Like Catholics.” The results there show that Catholic partisanship very closely mirrors the partisanship of the […]
LikeLike
[…] However, the standard deviation is really the item that should draw the most attention now. Which groups are more politically diverse in their viewpoints? It helps to look at the sample distributions that are flatter and don’t have a well-defined peak. Who fits the bill there? Non-white evangelicals, white mainline Protestants, and white Catholics. Which makes sense. The mainline is filled with old school, country club Republicans and younger social progressives. Non-white evangelicals are pulled in both directions, based on their social views as well as their opinions on immigration. Some Catholics are incredibly socially and politically conservative, while others are more moderate. […]
LikeLike
[…] that stands out to me is the Catholic result. In my estimation, they are the religious group that best mirrors the general consensus of the American electorate. In 2016, 50.1% of them voted for Donald Trump. However, in 2018, just […]
LikeLike